analysis
Provides analysis tools for wind data.
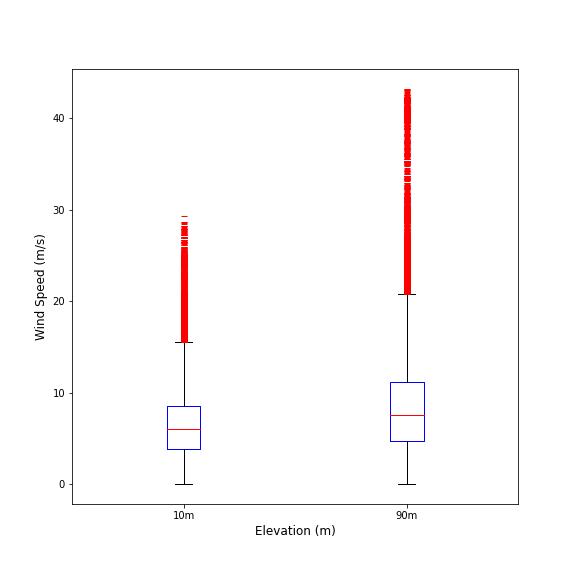
- albatross.analysis.boxplot(data, fields=None, labels=None, **box_kwargs)
Draws boxplots of wind speeds.
- Parameters
data (DataFrame) – wind data
fields (
listofstr, optional) – a list of columns to include from the given data. If none are provided, these will be inferred using any columns in data with the prefix ‘windspeed_’.labels (
listofstr, optional) – a list of labels to use. If none are provided, they will use the same names as fields. If no fields or labels are provided, they will both be inferred using the same strategy as fields, but taking the suffix after ‘windspeed_’. e.g. ‘windspeed_90m’ -> ‘90m’box_kwargs (dict, optional) – additional parameters for matplotlib.pyplot.boxplot
- Returns
A tuple (fig, ax) consisting of a matplotlib.figure.Figure and matplotlib.axes.Axes.
- Return type
tuple
- albatross.analysis.get_diurnal_stats(data, speed=None)
Returns basic relevant diurnal wind speed statistics for the given data.
- Parameters
data (DataFrame) – Wind data
speed (str, optional) – Wind speed column name. If not provided, it will be inferred from data. It will take the first column containing the string ‘windspeed’.
- Returns
A DataFrame consisting of an hourly time index, and columns representing various diurnal wind speed statistics for the given wind speed.
- Return type
DataFrame
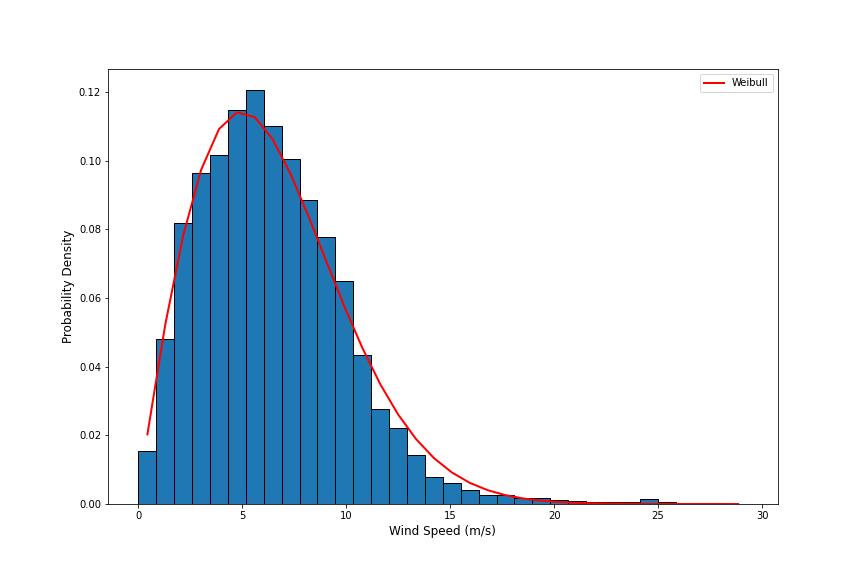
- albatross.analysis.pdf(data, speed=None, hist_kwargs=None, plot_kwargs=None)
Generates a Weibull probability density plot from the given data.
- Parameters
data (DataFrame) – Wind data
speed (str, optional) – Wind speed column name. If not provided, it will be inferred from data. It will take the first column containing the string ‘windspeed’.
hist_kwargs (dict, optional) – Additional histogram parameters.
plot_kwargs (dict, optional) – Additional plot parameters.
- Returns
(fig, ax, params) consisting of a matplotlib.figure.Figure, matplotlib.axes.Axes, and 4-element tuple of floats/ints representing shape (2), location, and scale.
- Return type
tuple
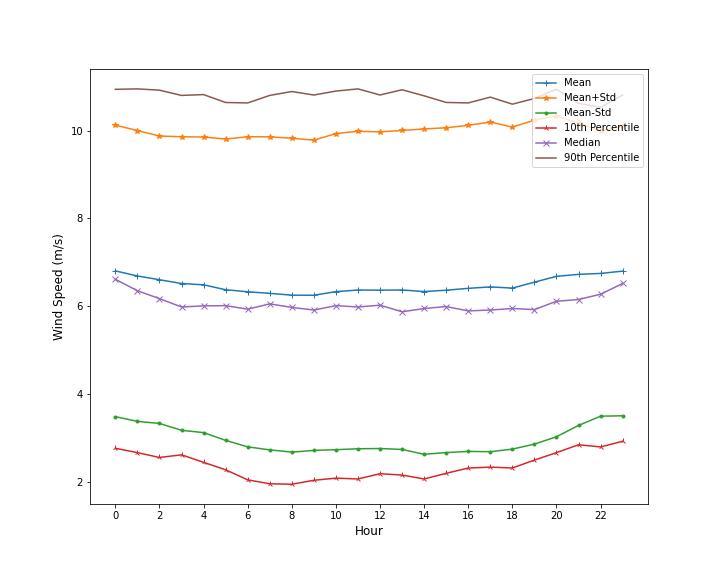
- albatross.analysis.plot_diurnal_stats(data, speed=None)
Plots basic relevant diurnal wind speed statistics for the given data.
- Parameters
data (DataFrame) – Wind data
speed (str, optional) – Wind speed column name. If not provided, it will be inferred from data. It will take the first column containing the string ‘windspeed’.
- Returns
A tuple (fig, ax, df) consisting of a matplotlib.figure.Figure, matplotlib.axes.Axes, and a pandas.DataFrame (same data as get_diurnal_stats).
- Return type
tuple
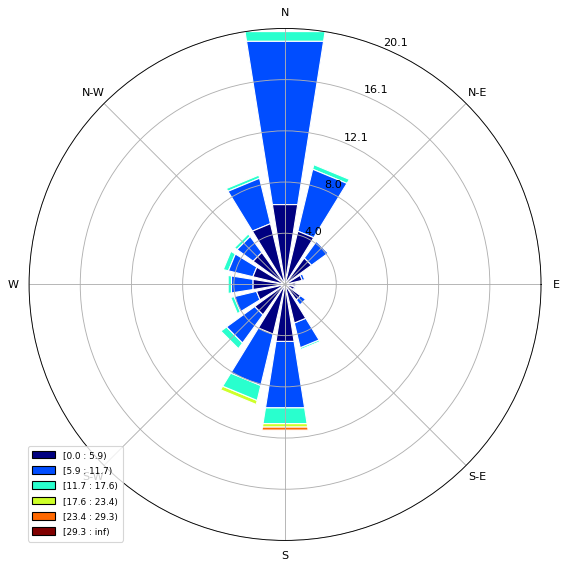
- albatross.analysis.plot_windrose(data, speed=None, direction=None, **wr_kwargs)
Generates a windrose plot from the given data.
- Parameters
data (DataFrame) – Wind data
speed (str, optional) – Wind speed column name. If not provided, it will be inferred from data. It will take the first column containing the string ‘windspeed’.
direction (str, optional) – Wind direction column name. If not provided, it will be inferred from data. It will take the first column containing the string winddirection.
wr_kwargs (dict, optional) – Additional windrose parameters. See https://windrose.readthedocs.io for more info.
- Returns
A WindroseAxes instance.
- Return type
WindroseAxes
- albatross.analysis.turbulence_std(data, turbine, speed=None, b=5.6)
Calculates the turbulence standard deviation.
- Parameters
data (Union[float, DataFrame]) – Wind speed velocity (m/s) at hub height.
turbine (WindTurbine) – A WindTurbine instance.
b (float, optional) – Additional adjustment parameter (m/s)
- Returns
Turbulence standard deviation.
- Return type
float